The Libraries and ITS participated in the Measuring Information Service Outcomes, er, the MISO survey this year. MISO is a web-based quantitative survey designed to measure how faculty, students and staff view library and computing services in higher education.
The two departments first participated in this nationally run survey in 2016 and decided to repeat the survey every three years. We hope to learn from longitudinal data and want to be aware of any trends.
The Libraries were particularly interested in the 2019 survey results, since the new version of our catalog, Tripod, launched in December and the survey ran shortly afterward, in February. We knew there were hiccups in the Tripod launch and were eager to compare the community responses about the library catalog to their responses in 2016.
Interestingly, while we have much still to learn from MISO results, there were no statistically significant differences in how our community views our services since 2016, including the catalog, Tripod. Yet, we are aware of deeper questions to ask of the data and of areas for which additional research is needed.
For example, we learned that a higher percentage of faculty do not use Tripod or library databases than we would expect and further discovered that the number of faculty who do not use these resources has increased from 2016 – 2019. The number of faculty who say they “do not use” Tripod rose from 7.4% in 2016 to 12.9% in 2019. We’re in the process of cross tabulating the data with help from colleagues in the Office of Institutional Research in order to learn the extent to which academic division or other factors may play a role in the increase.
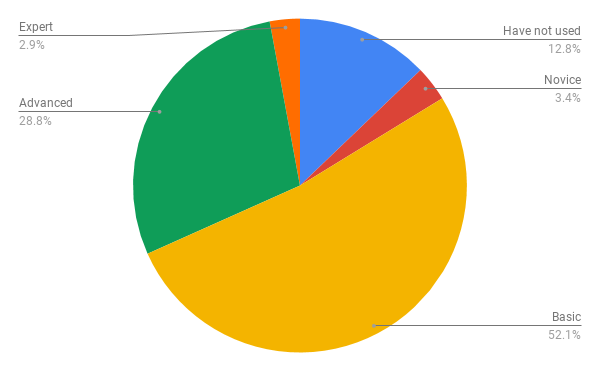
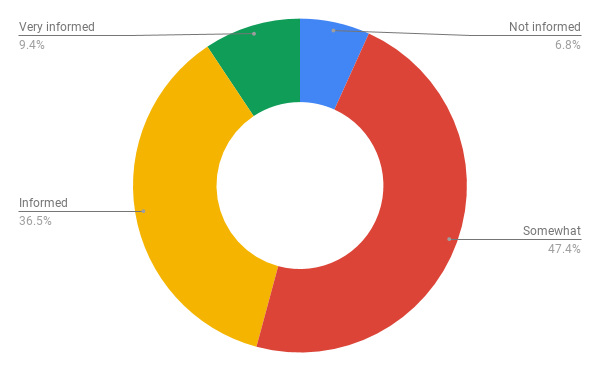
Another area for further exploration is the number of faculty, students and staff who say they feel “not informed” or only “somewhat informed” about library services. To help us communicate what services we offer more effectively, we need to first learn what people think of when they see the term “library services.” Do they think about circulation, or perhaps access to online resources? Naturally, we’d prefer a larger percentage of our users feel “Informed” about our services, so we’re thinking of ways to address this.
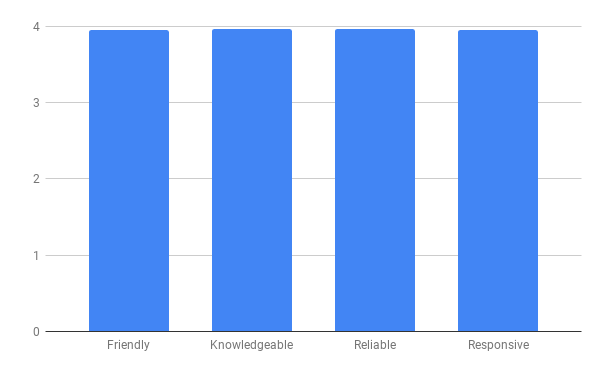
On a wonderful positive note, our faculty, staff and students continue to rate their satisfaction with librarians very highly, between 3.8 or 9 on a 4 point scale, for being friendly, knowledgeable, reliable and responsive. Thank you Swarthmore community – we love you right back!