How many computers do we need?

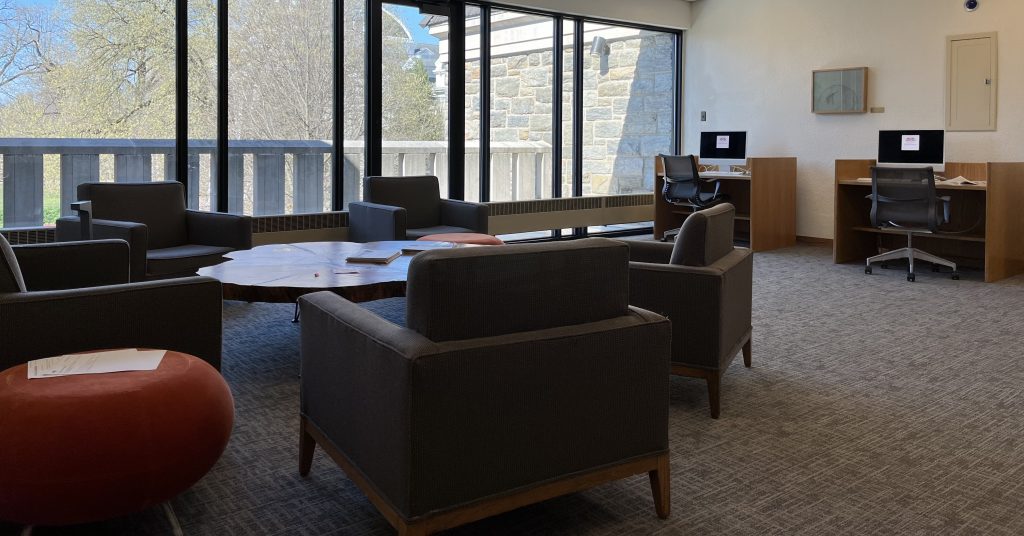
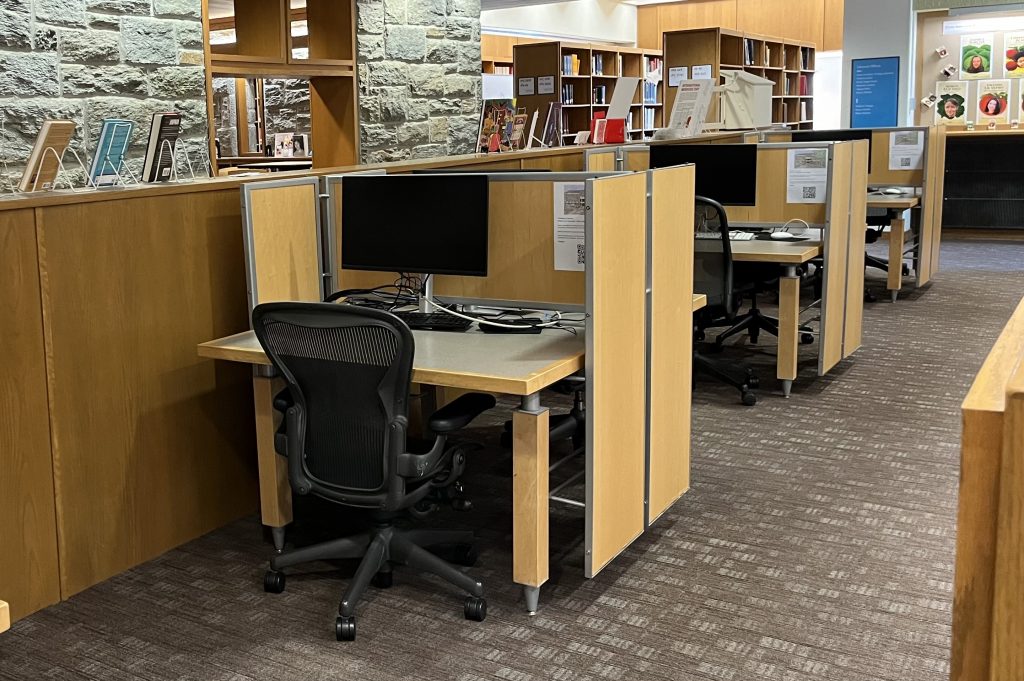
This summer, the main floor of McCabe will be renovated in order to create a home for the Teaching and Learning Commons. In order to make room for and welcome our new neighbors, we need to reconfigure space near the large printers, reducing the number of computers in the area pictured, below, near the printers.

Computer workstations near the printers in McCabe

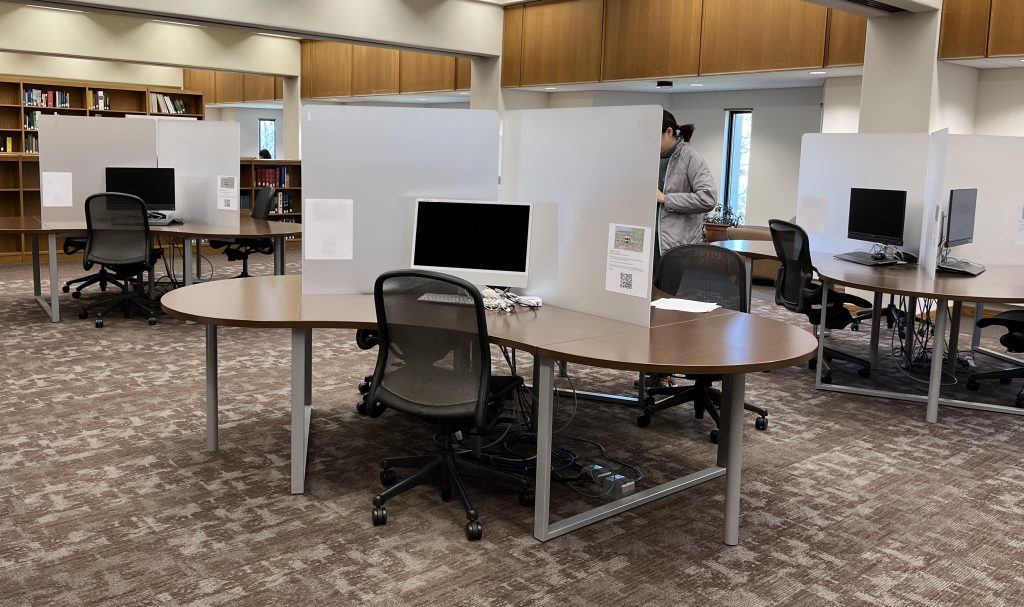
We’ve noticed less traffic in this area since the pandemic, but outside of anecdotal evidence, we need to learn how many desktop computers will meet our user’s needs. To find out, Access + User Services Supervisor, Patrick Sinko, and I looked at and analyzed the following data:

Quantitative Data

Our colleagues in ITS provided us with a spreadsheet that lists each computer in McCabe along with the following data points collected from August through December of 2023:

  • Number of logins
  • Total time the computer was in use, split between:
    • Active time
    • Idle time

We sorted the data by the number of logins and learned that the computers near the printer have the highest number – by far.

We next divided the amount of active time the computers were used by the number of logins to find an average of how much time people typically, actively spend at each of these computers and learned:

  • The computers closest to the printers are used for shorter periods of time, ranging from less than 10 minutes to up to 20 minutes
  • Computers further away from the printers are used for longer periods of time, with an overall average for these of 56 minutes
  • Users have a slight preference for Macs over PCs
  • PCs are used for longer periods of time than Macs

Qualitative data

Quantitative data is vital, but it doesn’t tell us why people choose to use computers in this area. To try to find out, we invited users to provide feedback via a form placed at each work station accessed by QR code. The form was anonymous, but to incentivize feedback, we agreed to send this “special edition sticker of McCabe” to any students who shared their names.

Special edition sticker of McCabe

We additionally included the row of docking stations in our qualitative study. (Docking stations are monitors + keyboards that people use connected to their personal device.) Even though the docking stations will remain available once the TLC renovation is complete, we wanted to get a sense of users’ preferences.

Docking stations (monitors + keyboards to be connected to personal devices) on the Main Floor

We received 32 responses to the form from February 2 through March 5, 2024. Here’s a summary of responses:

We first wanted to determine whether computer use was a priority, or whether perhaps the specific area of the library was a factor in choosing these spaces. We differentiated those possibilities in the first question on the form by asking “Why are you using this spot today?” and offered the following choices:

  • I’m using the computer or docking station
  • I like this spot and don’t need the computer or docking station
  • I’m here for both the equipment and the spot
  • Other

All but two users indicated that in addition to appreciating the spot, they were there to use the computer.

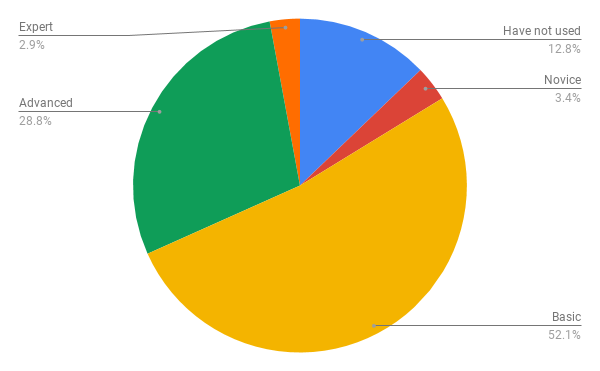
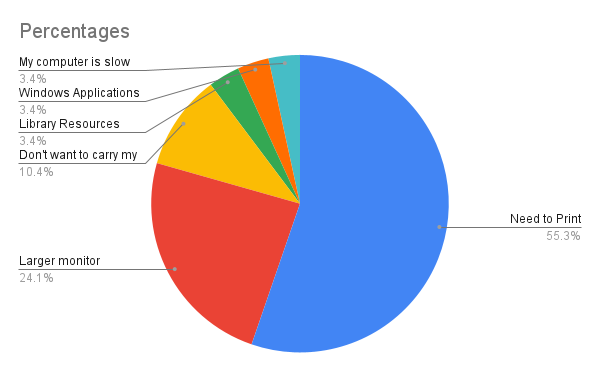
We next asked “If you’re using the computer, why?”

The qualitative data confirmed what we expected from the quantitative data: a majority of users were there to print. But what we had not anticipated was the level of desire for a larger (or additional) monitor.

Not wanting to carry (or having problems with) personal devices was the next highest reason, followed by one response for Access to Library Resources, and one for Access to Windows Applications.

Pie chart showing percentages for reasons why people choose to use the computers near the printers

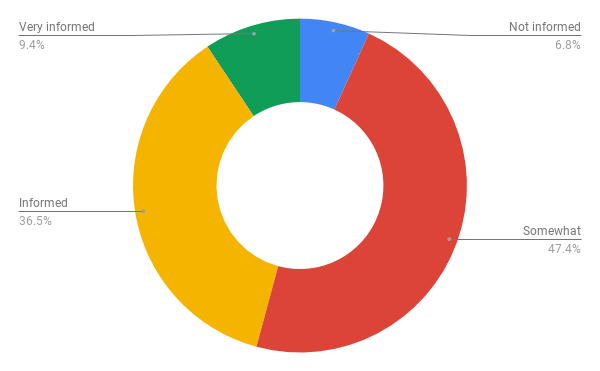
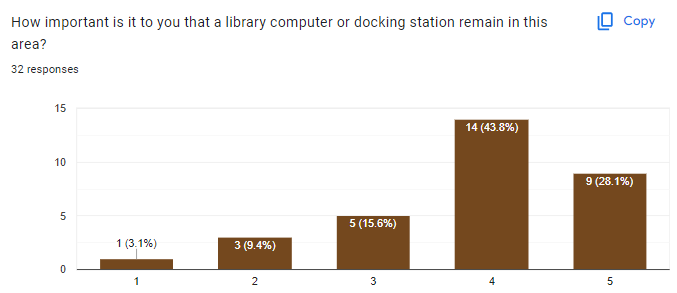
Next, we hoped to learn how important it is to users that computers (or docking stations) remain in this area. The answer? Pretty important:

Graph showing the importance of keeping computers and docking stations near the printers

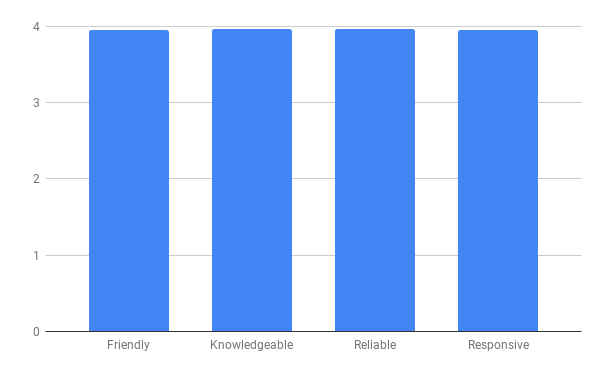
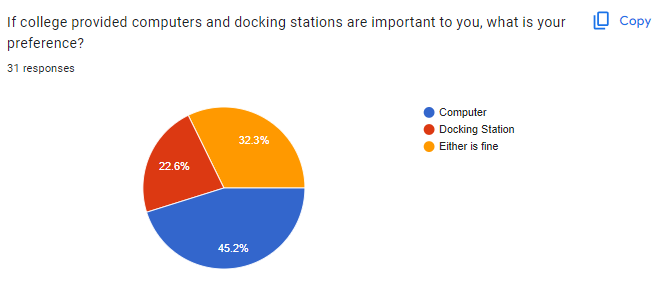
And finally, we wondered if our users have a preference for computers, or whether docking stations are fine. These results surprised me, since a docking station could just as easily satisfy the need for a larger, or second monitor and I had assumed a higher preference for these. I’ve just provided a great excellent example of why it’s important to get feedback from users rather than make assumptions. (You’re welcome!)

Pie chart showing preferences for computers or docking stations

Conclusion + Recommendations

It remains important for the libraries to provide computers near the printers, since as expected, they are used (a lot!) for printing.

  • If we keep our current furniture, reducing the number of tables from four to two will maintain space for 6 computers – a good number to accommodate printing needs. Since MACs are preferred, we could create a configuration of either 4 MACs and 2 PCs, or 3 of each type.
  • But if we swap out the current furniture for slightly less capacious workstations, we may be able to keep more computers in this area accommodating users who are drawn to work there for longer periods of time.

Although our form did not ask for specifics about why users like “this spot,” other studies (#SwatStudySpot, focus groups, and observational data) indicate preferences for:

  • natural light
  • a quiet hum of noise: quiet enough for focus, but without isolation and in the company of others
  • views to the outdoors or even expansive views inside buildings (high ceilings, large rooms, etc.)

While we may wish to find new homes in McCabe for the computers we’ll be moving away from the printers this summer, we should keep these characteristics in mind. Simply moving them to isolated places in McCabe may show decreased use.

Case in point: there are two computers on the 3rd floor that are used for longer periods of time (an average of 90 minutes or more) that are in an open lounge area near large windows and a balcony looking out over Parrish lawn. I would not have necessarily predicted this, but it makes perfect sense in light of what we know!

3rd floor lounge in McCabe with 2 Mac Computers

Digital Reserves Assessment, Spring 2021

Since more than half the Swarthmore student studied remotely this academic year due to the COVID-19 pandemic, the libraries needed to shift very quickly from providing print Course Reserves to providing digital copies of all required course materials. In the Spring of 2021, the Assessment Committee began to gather data in order to learn the answer to the following question:

What are the benefits of digital reserves to faculty and students and what are the costs to the libraries?

METHODS:

  • Faculty: we personally invited faculty who are known to make reserves requests to provide feedback via a questionnaire
  • Students: we held one focus group via zoom and used results of a campus-wide student survey on a pilot textbook affordability program (TAP). The libraries were able to add four questions to the survey to ask whether course readings on reserve at the libraries impacted student decisions to purchase textbooks
  • Library Staff: we gathered feedback first via department meetings of relevant staff and then held one, larger, inter-departmental meeting for further discussion

WHAT WE LEARNED

Faculty: While some faculty expressed dissatisfaction with particular digital platforms, they were appreciative of  having digital copies of required course texts available from the libraries during the pandemic and  expressed a desire that digital options remain available after all students are able to return to campus. One professor noted “I think students consult the material when it’s at their fingertips, so digital is a good idea.” and another wrote “Digital Reserves are accessible [meaning available] and helpful. Please keep them if it’s at all feasible.”

Students also appreciated access to digital copies of reserves materials, however, a majority of students used Textbook Affordability Program (TAP) Funds to purchase most of their required texts from the Campus and Community Store. Students in the focus group expressed an appreciation for choices between their purchased, print textbooks and the digital options the library provided. Although they purchased print texts, they made use of the library digital copies for pulling quotes and quick searches.

The results of the TAP Fund Survey indicated the program is successful, with students using the funds to purchase a majority of their course materials. While using course reserves at the libraries was the 2nd most frequent avenue to required reading, survey results demonstrate that the libraries may revisit their policy of providing library copies of every required text in light of the continuing availability of TAP Funds.

The survey also provided interesting data on reading preferences with a majority of students indicating a preference for reading in print rather than digitally. The results indicate that students choose digital copies when they are far less expensive, or when there are no print options available.​​​​

Library Staff worked heroically to provide digital access to course materials during the pandemic, including developing workflows to make in-house scans of needed materials that were not available digitally via any other source. While staff understand the value and benefit of digital copies for faculty and students, they want to provide them responsibly, considering accessibility (in the sense of accommodation), copyright, and the storage and management of the digital files we create.

WHAT WE DECIDED

The libraries will:

  • Use a hybrid approach to acquire print plus digital copies wherever possible from Ebook vendors for Course Reserves
  • Prioritize acquiring digital copies for Reserves, and in light of the TAP Fund Survey results, re-evaluate our policy to provide at least one print copy of every required text
  • Continue to explore responsible and robust options for Controlled Digital Lending (CDL) as options are developed 

Streaming Film Assessment

This year, the libraries are doing an assessment of our film collections in order to better understand how changes in the film industry and technology, particularly streaming options, are impacting the libraries’ materials budget.

We’re investigating everything we can think of:

  • Purchase requests
  • Statistics from our licensed streaming packages
  • Statistics for video placed on reserve and checkouts
  • How many “ripping” requests we receive (to make DVDs available for streaming) and how much time this requires
  • Film related workflows from request to delivery
  • What supports and services for providing film might be duplicated or supported by our campus partners, academic technologists in ITS and the Language Resource Center.

So far, we’ve:

  • Gathered statistics on:
    • Our streaming packages
    • Films placed on Reserve
    • Netflix use
  • Spoken to colleagues in the Language Resource Center to learn about all the ways they support the use of film in the curriculum
  • Devoted a student Library Advisory Board (LabX) meeting to get feedback from students about their film use in order to learn:
    • How often they use the collections for study breaks and entertainment
      • whether they consider checking out DVDs
      • what the libraries might do to make watching DVDs more convenient
    • How they view films required for class:
      • what happens if their schedule prevents them from viewing a film outside of class at a time the professor arranges?
      • how they watch a required film that may be available only through a platform the libraries are unable to support, like Amazon Prime or Hulu?

Our next step will be to send a short survey to about twenty professors who are known to use a lot of film in their courses in order to learn:

  • About how many films they may require in a film-heavy course
  • Whether their need for film is growing
    • Are standard courses taught from year to year impacted?
    • Does film play a larger role in newer courses?
    • Does the proliferation of available content suggest growing need?
  • What drives their preference for format?
    • Availability?
    • Accommodation (captioning, multi-language subtitles)?
    • Copyright?
    • Big screen vs laptop?
    • Picture and sound quality?
    • Convenience of delivery?
  • Are provisions made for students to view film outside of class time?
  • What if a film they want to include is available only on a platform the library cannot support (such as Amazon Prime or Hulu?) What accommodations do they make for students?
  • How might the libraries best support their need for film?
    • How might we improve the request process?
    • Should we investigate the feasibility of providing students with Amazon Prime, Hulu or other streaming platform accounts?
    • What other ideas and opportunities could there be?

We hope our assessment will inform:

  • Whether the evidence we gather supports advocating for more dollars in the budget, or guides difficult choices in order to balance the budget and curricular need
  • How we might improve our workflows from purchase request to film delivery
  • Hidden opportunities that may improve our collections and services in the future

If you have ideas of other avenues to explore, please let anyone on the AUX Committee know! (Assessment and User Experience)

Alison Masterpasqua, Amy McColl, Peggy Seiden, Barb Weir, Mary Huissen, Pam Harris, Pat O’Donnell – with much support for this project from Jessica Brangiel and Nabil Kashyap

Dog Days of Summer

It’s a Friday afternoon in the midst of a punishing heatwave in Swarthmore during the dog days of summer…

Photo by Paulette Wooten on Unsplash

…we’re just past the midpoint of the calendar year and a new academic year is on the horizon. What a good time to take stock of some of the goals we have achieved so far and to think about new ones for the upcoming year.

Since starting in this position, I’m proudest of these things:

  • IRB approval for usability testing
  • Approval to hire students at the highest pay grade who earn CITI certification and are trained as usability session facilitators
  • Robust usability sessions of our online library tools each month. Huzzah!
  • Establishment of an engaged Library Student Advisory Board for User eXperience (LabX) which meets monthly and provides invaluable feedback
  • Improved wayfinding signs in McCabe Library with the help of my colleague, Visual Initiatives + Exhibitions Librarian Susan Dreher

Some goals for this coming year:

  • Communicate my work more effectively through more frequent, shorter blog posts, posts to our library staff email digest, flyers, and an occasional newsletter (maybe…)
  • Collaborate with the AUX Committee to formalize our Assessment Plan based on our operational goals and objectives
  • Cultivate the use of our Data Dashboard for more cross-pollination of our data stories
  • Seek out relationships in the college community outside the libraries. I’m looking at you Office of Institutional Research, Communications Office and Center for Innovation and Leadership!
  • Continue to work on the ACRL Proficiencies for Assessment Librarians and Coordinators
  • Build relationships with librarians outside of Swarthmore College by becoming more active in professional organizations

Happy weekend – stay cool and hydrated!

MISO

The Libraries and ITS participated in the Measuring Information Service Outcomes, er, the MISO survey this year. MISO is a web-based quantitative survey designed to measure how faculty, students and staff view library and computing services in higher education.

The two departments first participated in this nationally run survey in 2016 and decided to repeat the survey every three years. We hope to learn from longitudinal data and want to be aware of any trends.

The Libraries were particularly interested in the 2019 survey results, since the new version of our catalog, Tripod, launched in December and the survey ran shortly afterward, in February. We knew there were hiccups in the Tripod launch and were eager to compare the community responses about the library catalog to their responses in 2016.

Interestingly, while we have much still to learn from MISO results, there were no statistically significant differences in how our community views our services since 2016, including the catalog, Tripod. Yet, we are aware of deeper questions to ask of the data and of areas for which additional research is needed.

For example, we learned that a higher percentage of faculty do not use Tripod or library databases than we would expect and further discovered that the number of faculty who do not use these resources has increased from 2016 – 2019. The number of faculty who say they “do not use” Tripod rose from 7.4% in 2016 to 12.9% in 2019. We’re in the process of cross tabulating the data with help from colleagues in the Office of Institutional Research in order to learn the extent to which academic division or other factors may play a role in the increase.

Faculty Survey: Skill Level with Tripod

Another area for further exploration is the number of faculty, students and staff who say they feel “not informed” or only “somewhat informed” about library services. To help us communicate what services we offer more effectively, we need to first learn what people think of when they see the term “library services.” Do they think about circulation, or perhaps access to online resources? Naturally, we’d prefer a larger percentage of our users feel “Informed” about our services, so we’re thinking of ways to address this.

Student Survey: How informed do you feel you are about library services?

On a wonderful positive note, our faculty, staff and students continue to rate their satisfaction with librarians very highly, between 3.8 or 9 on a 4 point scale, for being friendly, knowledgeable, reliable and responsive. Thank you Swarthmore community – we love you right back!

Staff Survey: How satisfied are you that the library circulation staff are: Friendly, Knowledgeable, Reliable and Responsive?

Serendipity…

…the occurrence and development of events by chance in a happy or beneficial way.

Several years ago, I was invited to work with a Swarthmore College alumnus to learn about website user experience and to use what I learned for our library catalog redesign project. The alumnus had offered his time to the College and I happened to be available and interested in a new project. While the redesign project was compelling, the biggest impact for me was the revelation of a new focus in librarianship.

My exposure to the power of observing how users navigate our tools created a deep interest, not only in how users interact with the shared, online tools we provide, like Tripod (our library catalog) and Research Guides, but also in the broader contest of the role of the libraries in the research process.

How do our users approach their research? How do they navigate finding what they seek? How can we best support this process? How do information architecture, web content, writing for the web and web design work together to propel research forward, or alternatively, raise barriers or introduce pain points that get in the way? How do we provide the best environment for discovery? What role do library spaces and services play in the research process?

One of my goals as the Assessment and User Experience Librarian @ Swarthmore is to communicate regularly about what I’ve learned from user experience and assessment projects. I’d like to share our practices for user research, be able to demonstrate why it’s important and what impact it has on our systems and spaces.

To close my first post, I’ll share the graphic, below, created by library UX practitioner Andy Priestner and first unveiled at his talk at the 2017 UX in Libraries conference in Glasgow. For additional fun, you may follow the prompts at this site created by another library UX practitioner, Vernon Fowler, and score where you think your library falls on these continua. For even more fun, try it as a group and talk about where you would place your library.